Difference between revisions of "Histogram"
(Importing text file) |
|||
| Line 1: | Line 1: | ||
| + | {{TEX|want}} | ||
| + | |||
A method for representing experimental data. A histogram is constructed as follows. The entire range of the observed values <img align="absmiddle" border="0" src="https://www.encyclopediaofmath.org/legacyimages/h/h047/h047450/h0474501.png" /> of some random variable <img align="absmiddle" border="0" src="https://www.encyclopediaofmath.org/legacyimages/h/h047/h047450/h0474502.png" /> is subdivided into <img align="absmiddle" border="0" src="https://www.encyclopediaofmath.org/legacyimages/h/h047/h047450/h0474503.png" /> grouping intervals (which are usually all of equal length) by points <img align="absmiddle" border="0" src="https://www.encyclopediaofmath.org/legacyimages/h/h047/h047450/h0474504.png" />; the number of observations <img align="absmiddle" border="0" src="https://www.encyclopediaofmath.org/legacyimages/h/h047/h047450/h0474505.png" /> per interval <img align="absmiddle" border="0" src="https://www.encyclopediaofmath.org/legacyimages/h/h047/h047450/h0474506.png" /> and the frequency <img align="absmiddle" border="0" src="https://www.encyclopediaofmath.org/legacyimages/h/h047/h047450/h0474507.png" /> are computed. The points <img align="absmiddle" border="0" src="https://www.encyclopediaofmath.org/legacyimages/h/h047/h047450/h0474508.png" /> are marked on the abscissa, and the segments <img align="absmiddle" border="0" src="https://www.encyclopediaofmath.org/legacyimages/h/h047/h047450/h0474509.png" /> (<img align="absmiddle" border="0" src="https://www.encyclopediaofmath.org/legacyimages/h/h047/h047450/h04745010.png" />) are taken as the bases of rectangles with heights <img align="absmiddle" border="0" src="https://www.encyclopediaofmath.org/legacyimages/h/h047/h047450/h04745011.png" />. If the intervals <img align="absmiddle" border="0" src="https://www.encyclopediaofmath.org/legacyimages/h/h047/h047450/h04745012.png" /> have equal lengths, the altitudes of the rectangles are taken as <img align="absmiddle" border="0" src="https://www.encyclopediaofmath.org/legacyimages/h/h047/h047450/h04745013.png" /> or as <img align="absmiddle" border="0" src="https://www.encyclopediaofmath.org/legacyimages/h/h047/h047450/h04745014.png" />. Thus, let the measurements of trunks of 1000 firs give the following results:''''''<table border="0" cellpadding="0" cellspacing="0" style="background-color:black;"> <tr><td> <table border="0" cellspacing="1" cellpadding="4" style="background-color:black;"> <tbody> <tr> <td colname="1" style="background-color:white;" colspan="1">diameter in cm.</td> <td colname="2" style="background-color:white;" colspan="1">22–27</td> <td colname="3" style="background-color:white;" colspan="1">27–32</td> <td colname="4" style="background-color:white;" colspan="1">32–37</td> <td colname="5" style="background-color:white;" colspan="1">37–42</td> <td colname="6" style="background-color:white;" colspan="1">42–52</td> </tr> <tr> <td colname="1" style="background-color:white;" colspan="1">number of trunks</td> <td colname="2" style="background-color:white;" colspan="1">100</td> <td colname="3" style="background-color:white;" colspan="1">130</td> <td colname="4" style="background-color:white;" colspan="1">500</td> <td colname="5" style="background-color:white;" colspan="1">170</td> <td colname="6" style="background-color:white;" colspan="1">100</td> </tr> </tbody> </table> | A method for representing experimental data. A histogram is constructed as follows. The entire range of the observed values <img align="absmiddle" border="0" src="https://www.encyclopediaofmath.org/legacyimages/h/h047/h047450/h0474501.png" /> of some random variable <img align="absmiddle" border="0" src="https://www.encyclopediaofmath.org/legacyimages/h/h047/h047450/h0474502.png" /> is subdivided into <img align="absmiddle" border="0" src="https://www.encyclopediaofmath.org/legacyimages/h/h047/h047450/h0474503.png" /> grouping intervals (which are usually all of equal length) by points <img align="absmiddle" border="0" src="https://www.encyclopediaofmath.org/legacyimages/h/h047/h047450/h0474504.png" />; the number of observations <img align="absmiddle" border="0" src="https://www.encyclopediaofmath.org/legacyimages/h/h047/h047450/h0474505.png" /> per interval <img align="absmiddle" border="0" src="https://www.encyclopediaofmath.org/legacyimages/h/h047/h047450/h0474506.png" /> and the frequency <img align="absmiddle" border="0" src="https://www.encyclopediaofmath.org/legacyimages/h/h047/h047450/h0474507.png" /> are computed. The points <img align="absmiddle" border="0" src="https://www.encyclopediaofmath.org/legacyimages/h/h047/h047450/h0474508.png" /> are marked on the abscissa, and the segments <img align="absmiddle" border="0" src="https://www.encyclopediaofmath.org/legacyimages/h/h047/h047450/h0474509.png" /> (<img align="absmiddle" border="0" src="https://www.encyclopediaofmath.org/legacyimages/h/h047/h047450/h04745010.png" />) are taken as the bases of rectangles with heights <img align="absmiddle" border="0" src="https://www.encyclopediaofmath.org/legacyimages/h/h047/h047450/h04745011.png" />. If the intervals <img align="absmiddle" border="0" src="https://www.encyclopediaofmath.org/legacyimages/h/h047/h047450/h04745012.png" /> have equal lengths, the altitudes of the rectangles are taken as <img align="absmiddle" border="0" src="https://www.encyclopediaofmath.org/legacyimages/h/h047/h047450/h04745013.png" /> or as <img align="absmiddle" border="0" src="https://www.encyclopediaofmath.org/legacyimages/h/h047/h047450/h04745014.png" />. Thus, let the measurements of trunks of 1000 firs give the following results:''''''<table border="0" cellpadding="0" cellspacing="0" style="background-color:black;"> <tr><td> <table border="0" cellspacing="1" cellpadding="4" style="background-color:black;"> <tbody> <tr> <td colname="1" style="background-color:white;" colspan="1">diameter in cm.</td> <td colname="2" style="background-color:white;" colspan="1">22–27</td> <td colname="3" style="background-color:white;" colspan="1">27–32</td> <td colname="4" style="background-color:white;" colspan="1">32–37</td> <td colname="5" style="background-color:white;" colspan="1">37–42</td> <td colname="6" style="background-color:white;" colspan="1">42–52</td> </tr> <tr> <td colname="1" style="background-color:white;" colspan="1">number of trunks</td> <td colname="2" style="background-color:white;" colspan="1">100</td> <td colname="3" style="background-color:white;" colspan="1">130</td> <td colname="4" style="background-color:white;" colspan="1">500</td> <td colname="5" style="background-color:white;" colspan="1">170</td> <td colname="6" style="background-color:white;" colspan="1">100</td> </tr> </tbody> </table> | ||
Revision as of 17:52, 15 February 2013
A method for representing experimental data. A histogram is constructed as follows. The entire range of the observed values  of some random variable
  is subdivided into
  grouping intervals (which are usually all of equal length) by points
  ; the number of observations
  per interval
  and the frequency
  are computed. The points
  are marked on the abscissa, and the segments
  (
( ) are taken as the bases of rectangles with heights
  . If the intervals
  have equal lengths, the altitudes of the rectangles are taken as
  or as
or as  . Thus, let the measurements of trunks of 1000 firs give the following results:'
<tbody> </tbody>
|
The histogram for this example is shown in the figure. diameter in cm. number of trunks
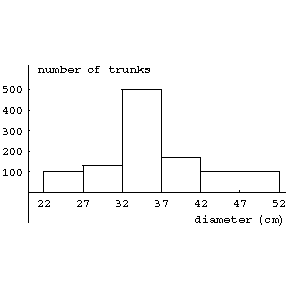
Figure: h047450a
Comments
The histogram can be considered as a technique of density estimation (cf. also Density of a probability distribution), and there is much literature on its properties as a statistical estimator of an unknown probability density as  and the grouping intervals are made smaller (grouping intervals of lengths
  seem optimal).
References
| [a1] | D. Freedman, P. Diaconis, "On the histogram as a density estimator:  theory" Z. Wahrsch. Verw. Geb. , 57 (1981) pp. 453–476 theory" Z. Wahrsch. Verw. Geb. , 57 (1981) pp. 453–476 |
Histogram. Encyclopedia of Mathematics. URL: http://encyclopediaofmath.org/index.php?title=Histogram&oldid=29440