Correlation (in statistics)
A dependence between random variables not necessarily expressed by a rigorous functional relationship. Unlike functional dependence, a correlation is, as a rule, considered when one of the random variables depends not only on the other (given) one, but also on several random factors. The dependence between two random events is manifested in the fact that the conditional probability of one of them, given the occurrence of the other, differs from the unconditional probability. Similarly, the influence of one random variable on another is characterized by the conditional distributions of one of them, given fixed values of the other. Let  and
and  be random variables with given joint distribution, let
  and
and  be the expectations of
  and
and  , let
, let  and
and  be the variances of
  and
and  , and let
  be the correlation coefficient of
  and
and  . Assume that for every possible value
  the conditional mathematical expectation
  of
of  is defined; then the function
  is known as the regression of
  given
given  , and its graph is the regression curve of
  given
given  . The dependence of
  on
on  is manifested in the variation of the mean values of
  as
as  varies, although for each fixed value
  ,
,  remains a random variable with a well-defined spread. In order to determine to what degree of accuracy the regression reproduces the variation of
  as
as  varies, one uses the conditional variance of
  for a given
  or its mean value (a measure of the spread of
  about the regression curve):
 |
If  and
and  are independent, then all conditional mathematical expectations of
  are independent of
  and coincide with the unconditional expectations:
  ; and then also
  . When
  is a function of
  in the strict sense of the word, then for each
  the variable
  takes only one definite value and
  . Similarly one defines
  (the regression of
  given
given  ). A natural index of the concentration of the distribution near the regression curve
  is the correlation ratio
 |
One has  if and only if the regression has the form
  , and in that case the correlation coefficient
  vanishes and
  is not correlated with
  . If the regression of
  given
given  is linear, i.e. the regression curve is the straight line
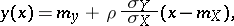 |
then
 |
if, moreover,  , then
  is related to
  through an exact linear dependence; but if
 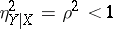 , there is no functional dependence between
  and
and  . There is an exact functional dependence of
  on
on  , other than a linear one, if and only if
 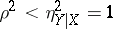 . With rare exceptions, the practical use of the correlation coefficient as a measure of the lack of dependence is justifiable only when the joint distribution of
  and
and  is normal (or close to normal), since in that case
  implies that
  and
and  are independent. Use of
  as a measure of dependence for arbitrary random variables
  and
and  frequently leads to erroneous conclusions, since
  may vanish even when a functional dependence exists. If the joint distribution of
  and
and  is normal, then both regression curves are straight lines and
  uniquely determines the concentration of the distribution near the regression curves: When
  the regression curves merge into one, corresponding to linear dependence between
  and
and  ; when
  one has independence.
When studying the interdependence of several random variables  with a given joint distribution, one uses multiple and partial correlation ratios and coefficients. The latter are evaluated using the ordinary correlation coefficients between
  and
and  , the totality of which form the correlation matrix. A measure of the linear relationship between
  and the totality of the other variables
  is provided by the multiple-correlation coefficient. If the mutual relationship of
  and
and  is assumed to be determined by the influence of the other variables
  , then the partial correlation coefficient of
  and
and  with respect to
  is an index of the linear relationship between
  and
and  relative to
  .
.
For measures of correlation based on rank statistics (cf. Rank statistic) see Kendall coefficient of rank correlation; Spearman coefficient of rank correlation.
Mathematical statisticians have developed methods for estimating coefficients that characterize the correlation between random variables or tests; there are also methods to test hypotheses concerning their values, using their sampling analogues. These methods are collectively known as correlation analysis. Correlation analysis of statistical data consists of the following basic practical steps: 1) the construction of a scatter plot and the compilation of a correlation table; 2) the computation of sampling correlation ratios or correlation coefficients; 3) testing statistical hypothesis concerning the significance of the dependence. Further investigation may consist in establishing the concrete form of the dependence between the variables (see Regression).
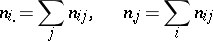
Among the aids to analysis of two-dimensional sample data are the scatter plot and the correlation table. The scatter plot is obtained by plotting the sample points on the coordinate plane. Examination of the configuration formed by the points of the scatter plot yields a preliminary idea of the type of dependence between the random variables (e.g. whether one of the variables increases or decreases on the average as the other increases). Prior to numerical processing, the results are usually grouped and presented in the form of a correlation table. In each entry of this table one writes the number  of pairs
  with components in the appropriate grouping intervals. Assuming that the grouping intervals (in each of the variables) are equal in length, one takes the centres
  (or
(or  ) of the intervals and the numbers
  as the basis for calculation.
For more accurate information about the nature and strength of the relationship than that provided by the scatter plot, one turns to the correlation coefficient and correlation ratio. The sample correlation coefficient is defined by the formula
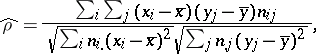 |
where
 |
and
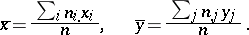 |
In the case of a large number of independent observations, governed by one and the same near-normal distribution,  is a good approximation to the true correlation coefficient
  . In all other cases, as characteristic of strength of the relationship the correlation ratio is recommended, the interpretation of which is independent of the type of dependence being studied. The sample value
  is computed from the entries in the correlation table:
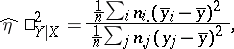 |
where the numerator represents the spread of the conditional mean values  about the unconditional mean
  (the sample value
  is defined analogously). The quantity
  is used as an indicator of the deviation of the regression from linearity.
The testing of hypotheses concerning the significance of a relationship are based on the distributions of the sample correlation characteristics. In the case of a normal distribution, the value of the sample correlation coefficient  is significantly distinct from zero if
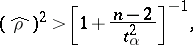 |
where  is the critical value of the Student
  -distribution with
  degrees of freedom corresponding to the chosen significance level
  . If
. If  one usually uses the Fisher
  -transform, with
  replaced by
  according to the formula
 |
Even at relatively small values  the distribution of
  is a good approximation to the normal distribution with mathematical expectation
 |
and variance  . On this basis one can now define approximate confidence intervals for the true correlation coefficient
  .
.
For the distribution of the sample correlation ratio and for tests of the linearity hypothesis for the regression, see [3].
References
| [1] | H. Cramér, "Mathematical methods of statistics" , Princeton Univ. Press (1946) |
| [2] | B.L. van der Waerden, "Mathematische Statistik" , Springer (1957) |
| [3] | M.G. Kendall, A. Stuart, "The advanced theory of statistics" , 2. Inference and relationship , Griffin (1979) |
| [4] | S.A. Aivazyan, "Statistical research on dependence" , Moscow (1968) (In Russian) |
Correlation (in statistics). Encyclopedia of Mathematics. URL: http://encyclopediaofmath.org/index.php?title=Correlation_(in_statistics)&oldid=11629